One of the most popular InnoDB’s errors is InnoDB lock wait timeout exceeded, for example:
SQLSTATE[HY000]: General error: 1205 Lock wait timeout exceeded; try restarting transactionThe above simply means the transaction has reached the innodb_lock_wait_timeout while waiting to obtain an exclusive lock which defaults to 50 seconds. The common causes are:
- The offensive transaction is not fast enough to commit or rollback the transaction within innodb_lock_wait_timeout duration.
- The offensive transaction is waiting for row lock to be released by another transaction.
The Effects of a InnoDB Lock Wait Timeout
InnoDB lock wait timeout can cause two major implications:
- The failed statement is not being rolled back by default.
- Even if innodb_rollback_on_timeout is enabled, when a statement fails in a transaction, ROLLBACK is still a more expensive operation than COMMIT.
Let’s play around with a simple example to better understand the effect. Consider the following two tables in database mydb:
mysql> CREATE SCHEMA mydb;
mysql> USE mydb;
The first table (table1):
mysql> CREATE TABLE table1 ( id INT PRIMARY KEY AUTO_INCREMENT, data VARCHAR(50));
mysql> INSERT INTO table1 SET data = 'data #1';
The second table (table2):
mysql> CREATE TABLE table2 LIKE table1;
mysql> INSERT INTO table2 SET data = 'data #2';
We executed our transactions in two different sessions in the following order:
|
Ordering |
Transaction #1 (T1) |
Transaction #2 (T2) |
|
1 |
SELECT * FROM table1; (OK) |
SELECT * FROM table1; (OK) |
|
2 |
UPDATE table1 SET data = ‘T1 is updating the row’ WHERE id = 1; (OK) |
|
|
3 |
UPDATE table2 SET data = ‘T2 is updating the row’ WHERE id = 1; (OK) |
|
|
4 |
UPDATE table1 SET data = ‘T2 is updating the row’ WHERE id = 1; (Hangs for a while and eventually returns an error “Lock wait timeout exceeded; try restarting transaction”) |
|
|
5 |
COMMIT; (OK) |
|
|
6 |
COMMIT; (OK) |
mysql> SELECT * FROM table1 WHERE id = 1;
+----+-----------------------------------+
| id | data                              |
+----+-----------------------------------+
| 1  | T1 is updating the row            |
+----+-----------------------------------+


mysql> SELECT * FROM table2 WHERE id = 1;
+----+-----------------------------------+
| id | data                              |
+----+-----------------------------------+
| 1  | T2 is updating the row            |
+----+-----------------------------------+
After T2 was successfully committed, one would expect to get the same output “T2 is updating the row” for both table1 and table2 but the results show that only table2 was updated. One might think that if any error encounters within a transaction, all statements in the transaction would automatically get rolled back, or if a transaction is successfully committed, the whole statements were executed atomically. This is true for deadlock, but not for InnoDB lock wait timeout.
Unless you set innodb_rollback_on_timeout=1 (default is 0 – disabled), automatic rollback is not going to happen for InnoDB lock wait timeout error. This means, by following the default setting, MySQL is not going to fail and rollback the whole transaction, nor retrying again the timed out statement and just process the next statements until it reaches COMMIT or ROLLBACK. This explains why transaction T2 was partially committed!
The InnoDB documentation clearly says “InnoDB rolls back only the last statement on a transaction timeout by default”. In this case, we do not get the transaction atomicity offered by InnoDB. The atomicity in ACID compliant is either we get all or nothing of the transaction, which means partial transaction is merely unacceptable.
Dealing With a InnoDB Lock Wait Timeout
So, if you are expecting a transaction to auto-rollback when encounters an InnoDB lock wait error, similarly as what would happen in deadlock, set the following option in MySQL configuration file:
innodb_rollback_on_timeout=1A MySQL restart is required. When deploying a MySQL-based cluster, ClusterControl will always set innodb_rollback_on_timeout=1 on every node. Without this option, your application has to retry the failed statement, or perform ROLLBACK explicitly to maintain the transaction atomicity.
To verify if the configuration is loaded correctly:
mysql> SHOW GLOBAL VARIABLES LIKE 'innodb_rollback_on_timeout';
+----------------------------+-------+
| Variable_name              | Value |
+----------------------------+-------+
| innodb_rollback_on_timeout | ON    |
+----------------------------+-------+
To check whether the new configuration works, we can track the com_rollback counter when this error happens:
mysql> SHOW GLOBAL STATUS LIKE 'com_rollback';
+---------------+-------+
| Variable_name | Value |
+---------------+-------+
| Com_rollback  | 1     |
+---------------+-------+
Tracking the Blocking Transaction
There are several places that we can look to track the blocking transaction or statements. Let’s start by looking into InnoDB engine status under TRANSACTIONS section:
mysql> SHOW ENGINE INNODB STATUSG
mysql> SHOW ENGINE INNODB STATUSG
------------
TRANSACTIONS
------------

...

---TRANSACTION 3100, ACTIVE 2 sec starting index read
mysql tables in use 1, locked 1
LOCK WAIT 2 lock struct(s), heap size 1136, 1 row lock(s)
MySQL thread id 50, OS thread handle 139887555282688, query id 360 localhost ::1 root updating
update table1 set data = 'T2 is updating the row' where id = 1

------- TRX HAS BEEN WAITING 2 SEC FOR THIS LOCK TO BE GRANTED:
RECORD LOCKS space id 6 page no 4 n bits 72 index PRIMARY of table `mydb`.`table1` trx id 3100 lock_mode X locks rec but not gap waiting
Record lock, heap no 2 PHYSICAL RECORD: n_fields 4; compact format; info bits 0
 0: len 4; hex 80000001; asc     ;;
 1: len 6; hex 000000000c19; asc       ;;
 2: len 7; hex 020000011b0151; asc       Q;;
 3: len 22; hex 5431206973207570646174696e672074686520726f77; asc T1 is updating the row;;
------------------

---TRANSACTION 3097, ACTIVE 46 sec
2 lock struct(s), heap size 1136, 1 row lock(s), undo log entries 1
MySQL thread id 48, OS thread handle 139887556167424, query id 358 localhost ::1 root
Trx read view will not see trx with id >= 3097, sees < 3097
From the above information, we can get an overview of the transactions that are currently active in the server. Transaction 3097 is currently locking a row that needs to be accessed by transaction 3100. However, the above output does not tell us the actual query text that could help us figuring out which part of the query/statement/transaction that we need to investigate further. By using the blocker MySQL thread ID 48, let's see what we can gather from MySQL processlist:
mysql> SHOW FULL PROCESSLIST;
+----+-----------------+-----------------+--------------------+---------+------+------------------------+-----------------------+
| Id | User            | Host            | db                 | Command | Time | State                  | Info                  |
+----+-----------------+-----------------+--------------------+---------+------+------------------------+-----------------------+
| 4  | event_scheduler | localhost       |              | Daemon  | 5146 | Waiting on empty queue |                 |
| 10 | root            | localhost:56042 | performance_schema | Query   | 0    | starting               | show full processlist |
| 48 | root            | localhost:56118 | mydb               | Sleep   | 145  |                        |                 |
| 50 | root            | localhost:56122 | mydb               | Sleep   | 113  |                        |                 |
+----+-----------------+-----------------+--------------------+---------+------+------------------------+-----------------------+
Thread ID 48 shows the command as 'Sleep'. Still, this does not help us much to know which statements that block the other transaction. This is because the statement in this transaction has been executed and this open transaction is basically doing nothing at the moment. We need to dive further down to see what is going on with this thread.
For MySQL 8.0, the InnoDB lock wait instrumentation is available under data_lock_waits table inside performance_schema database (or innodb_lock_waits table inside sys database). If a lock wait event is happening, we should see something like this:
mysql> SELECT * FROM performance_schema.data_lock_waitsG
***************************[ 1. row ]***************************
ENGINE                           | INNODB
REQUESTING_ENGINE_LOCK_ID        | 139887595270456:6:4:2:139887487554680
REQUESTING_ENGINE_TRANSACTION_ID | 3100
REQUESTING_THREAD_ID             | 89
REQUESTING_EVENT_ID              | 8
REQUESTING_OBJECT_INSTANCE_BEGIN | 139887487554680
BLOCKING_ENGINE_LOCK_ID          | 139887595269584:6:4:2:139887487548648
BLOCKING_ENGINE_TRANSACTION_ID   | 3097
BLOCKING_THREAD_ID               | 87
BLOCKING_EVENT_ID                | 9
BLOCKING_OBJECT_INSTANCE_BEGIN   | 139887487548648
Note that in MySQL 5.6 and 5.7, the similar information is stored inside innodb_lock_waits table under information_schema database. Pay attention to the BLOCKING_THREAD_ID value. We can use the this information to look for all statements being executed by this thread in events_statements_history table:
mysql> SELECT * FROM performance_schema.events_statements_history WHERE `THREAD_ID` = 87;
0 rows in set
It looks like the thread information is no longer there. We can verify by checking the minimum and maximum value of the thread_id column in events_statements_history table with the following query:
mysql> SELECT min(`THREAD_ID`), max(`THREAD_ID`) FROM performance_schema.events_statements_history;
+------------------+------------------+
| min(`THREAD_ID`) | max(`THREAD_ID`) |
+------------------+------------------+
| 98               | 129              |
+------------------+------------------+
The thread that we were looking for (87) has been truncated from the table. We can confirm this by looking at the size of event_statements_history table:
mysql> SELECT @@performance_schema_events_statements_history_size;
+-----------------------------------------------------+
| @@performance_schema_events_statements_history_size |
+-----------------------------------------------------+
| 10                                                  |
+-----------------------------------------------------+
The above means the events_statements_history can only store the last 10 threads. Fortunately, performance_schema has another table to store more rows called events_statements_history_long, which stores similar information but for all threads and it can contain way more rows:
mysql> SELECT @@performance_schema_events_statements_history_long_size;
+----------------------------------------------------------+
| @@performance_schema_events_statements_history_long_size |
+----------------------------------------------------------+
| 10000                                                    |
+----------------------------------------------------------+
However, you will get an empty result if you try to query the events_statements_history_long table for the first time. This is expected because by default, this instrumentation is disabled in MySQL as we can see in the following setup_consumers table:
mysql> SELECT * FROM performance_schema.setup_consumers;
+----------------------------------+---------+
| NAME                             | ENABLED |
+----------------------------------+---------+
| events_stages_current            | NO      |
| events_stages_history            | NO      |
| events_stages_history_long       | NO      |
| events_statements_current        | YES     |
| events_statements_history        | YES     |
| events_statements_history_long   | NO      |
| events_transactions_current      | YES     |
| events_transactions_history      | YES     |
| events_transactions_history_long | NO      |
| events_waits_current             | NO      |
| events_waits_history             | NO      |
| events_waits_history_long        | NO      |
| global_instrumentation           | YES     |
| thread_instrumentation           | YES     |
| statements_digest                | YES     |
+----------------------------------+---------+
To activate table events_statements_history_long, we need to update the setup_consumers table as below:
mysql> UPDATE performance_schema.setup_consumers SET enabled = 'YES' WHERE name = 'events_statements_history_long';Verify if there are rows in the events_statements_history_long table now:
mysql> SELECT count(`THREAD_ID`) FROM performance_schema.events_statements_history_long;
+--------------------+
| count(`THREAD_ID`) |
+--------------------+
| 4                  |
+--------------------+
Cool. Now we can wait until the InnoDB lock wait event raises again and when it is happening, you should see the following row in the data_lock_waits table:
mysql> SELECT * FROM performance_schema.data_lock_waitsG
***************************[ 1. row ]***************************
ENGINE                           | INNODB
REQUESTING_ENGINE_LOCK_ID        | 139887595270456:6:4:2:139887487555024
REQUESTING_ENGINE_TRANSACTION_ID | 3083
REQUESTING_THREAD_ID             | 60
REQUESTING_EVENT_ID              | 9
REQUESTING_OBJECT_INSTANCE_BEGIN | 139887487555024
BLOCKING_ENGINE_LOCK_ID          | 139887595269584:6:4:2:139887487548648
BLOCKING_ENGINE_TRANSACTION_ID   | 3081
BLOCKING_THREAD_ID               | 57
BLOCKING_EVENT_ID                | 8
BLOCKING_OBJECT_INSTANCE_BEGIN   | 139887487548648
Again, we use the BLOCKING_THREAD_ID value to filter all statements that have been executed by this thread against events_statements_history_long table:
mysql> SELECT `THREAD_ID`,`EVENT_ID`,`EVENT_NAME`, `CURRENT_SCHEMA`,`SQL_TEXT` FROM events_statements_history_long
WHERE `THREAD_ID` = 57
ORDER BY `EVENT_ID`;
+-----------+----------+-----------------------+----------------+----------------------------------------------------------------+
| THREAD_ID | EVENT_ID | EVENT_NAME            | CURRENT_SCHEMA | SQL_TEXT                                                       |
+-----------+----------+-----------------------+----------------+----------------------------------------------------------------+
| 57        | 1        | statement/sql/select  |          | select connection_id()                                         |
| 57        | 2        | statement/sql/select  |          | SELECT @@VERSION                                               |
| 57        | 3        | statement/sql/select  |          | SELECT @@VERSION_COMMENT                                       |
| 57        | 4        | statement/com/Init DB |          |                                                          |
| 57        | 5        | statement/sql/begin   | mydb           | begin                                                          |
| 57        | 7        | statement/sql/select  | mydb           | select 'T1 is in the house'                                    |
| 57        | 8        | statement/sql/select  | mydb           | select * from table1                                           |
| 57        | 9        | statement/sql/select  | mydb           | select 'some more select'                                      |
| 57        | 10       | statement/sql/update  | mydb           | update table1 set data = 'T1 is updating the row' where id = 1 |
+-----------+----------+-----------------------+----------------+----------------------------------------------------------------+
Finally, we found the culprit. We can tell by looking at the sequence of events of thread 57 where the above transaction (T1) still has not finished yet (no COMMIT or ROLLBACK), and we can see the very last statement has obtained an exclusive lock to the row for update operation which needed by the other transaction (T2) and just hanging there. That explains why we see 'Sleep' in the MySQL processlist output.
As we can see, the above SELECT statement requires you to get the thread_id value beforehand. To simplify this query, we can use IN clause and a subquery to join both tables. The following query produces an identical result like the above:
mysql> SELECT `THREAD_ID`,`EVENT_ID`,`EVENT_NAME`, `CURRENT_SCHEMA`,`SQL_TEXT` from events_statements_history_long WHERE `THREAD_ID` IN (SELECT `BLOCKING_THREAD_ID` FROM data_lock_waits) ORDER BY `EVENT_ID`;
+-----------+----------+-----------------------+----------------+----------------------------------------------------------------+
| THREAD_ID | EVENT_ID | EVENT_NAME            | CURRENT_SCHEMA | SQL_TEXT                                                       |
+-----------+----------+-----------------------+----------------+----------------------------------------------------------------+
| 57        | 1        | statement/sql/select  |          | select connection_id()                                         |
| 57        | 2        | statement/sql/select  |          | SELECT @@VERSION                                               |
| 57        | 3        | statement/sql/select  |          | SELECT @@VERSION_COMMENT                                       |
| 57        | 4        | statement/com/Init DB |          |                                                          |
| 57        | 5        | statement/sql/begin   | mydb           | begin                                                          |
| 57        | 7        | statement/sql/select  | mydb           | select 'T1 is in the house'                                    |
| 57        | 8        | statement/sql/select  | mydb           | select * from table1                                           |
| 57        | 9        | statement/sql/select  | mydb           | select 'some more select'                                      |
| 57        | 10       | statement/sql/update  | mydb           | update table1 set data = 'T1 is updating the row' where id = 1 |
+-----------+----------+-----------------------+----------------+----------------------------------------------------------------+
However, it is not practical for us to execute the above query whenever InnoDB lock wait event occurs. Apart from the error from the application, how would you know that the lock wait event is happening? We can automate this query execution with the following simple Bash script, called track_lockwait.sh:
$ cat track_lockwait.sh
#!/bin/bash
## track_lockwait.sh
## Print out the blocking statements that causing InnoDB lock wait

INTERVAL=5
DIR=/root/lockwait/

[ -d $dir ] || mkdir -p $dir

while true; do
  check_query=$(mysql -A -Bse 'SELECT THREAD_ID,EVENT_ID,EVENT_NAME,CURRENT_SCHEMA,SQL_TEXT FROM events_statements_history_long WHERE THREAD_ID IN (SELECT BLOCKING_THREAD_ID FROM data_lock_waits) ORDER BY EVENT_ID')

  # if $check_query is not empty
  if [[ ! -z $check_query ]]; then
    timestamp=$(date +%s)
    echo $check_query > $DIR/innodb_lockwait_report_${timestamp}
  fi

  sleep $INTERVAL
done
Apply executable permission and daemonize the script in the background:
$ chmod 755 track_lockwait.sh
$ nohup ./track_lockwait.sh &
Now, we just need to wait for the reports to be generated under the /root/lockwait directory. Depending on the database workload and row access patterns, you might probably see a lot of files under this directory. Monitor the directory closely otherwise it would be flooded with too many report files.
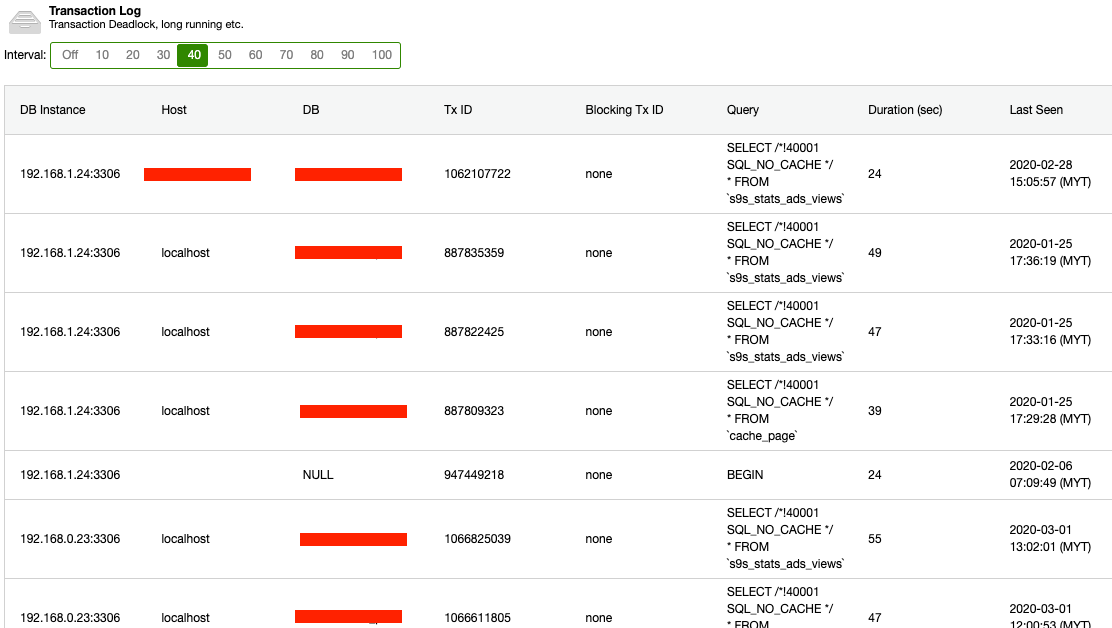
If you are using ClusterControl, you can enable the Transaction Log feature under Performance -> Transaction Log where ClusterControl will provide a report on deadlocks and long-running transactions which will ease up your life in finding the culprit.
Conclusion
In summary, if we face a “Lock Wait Timeout Exceeded” error in MySQL, we need to first understand the effects that such an error can have to our infrastructure, then track the offensive transaction and act on it either with shell scripts like track_lockwait.sh, or database management software like ClusterControl.
If you decide to go with shell scripts, just bear in mind that they may save you money but will cost you time, as you’d need to know a thing or two about how they work, apply permissions, and possibly make them run in the background, and if you do get lost in the shell jungle, we can help.
Whatever you decide to implement, make sure to follow us on Twitter or subscribe to our RSS feed to get more tips on improving the performance of both your software and the databases backing it, such as this post covering 6 common failure scenarios in MySQL.
source : https://severalnines.com/blog/